티스토리 뷰
1️⃣ 딕셔너리 (Dictionary)
키와 값이 키:값 형태로 이루어진 데이터 구조
{ key: value }- key : 값을 찾기 위해 넣어 주는 데이터
- value : 찾고자 하는 데이터
empty_dict = {}

new_dict = {
 'apple': '사과',
 'book': '책',
 'human': '사람',
}

dictionary = {}
dictionary['apple'] = '사과'
dictionary['book'] = '책'
dictionary['human'] = '사람'
- 딕서너리 vs 리스트
딕셔너리는 키와 값이 쌍을 이루기 때문에 키를 이용해 값을 빠르게 찾아낼 수 있습니다.
리스트는 모든 값를 확인해야 하므로, 데이터가 많을 경우 수십 배 까지도 성능 차이가 날 수 있다.
# id가 kdhong.elice인 사람의 이름 찾기

# 딕셔러니
accounts = {
    "kdhong.elice": "Kildong Hong",
    …
}
print(accounts["kdhong.elice"])


# 리스트
accounts = [
    ("kdhong.elice", "Kildong Hong"),
    …
]
for id_, name in accounts:
    if id_ == "kdhong.elice":
        print(name)
- 딕셔너리의 키
변할 수 없는 값만이 key가 될 수 있다
# {[ID, 비밀번호]: 계정 정보}
kdhong = ["kdhong", "cantcalldad"]  # ("kdhong", "cantcalldad") 튜플이어야 함
accounts = {
    kdhong: ('Kildong Hong', …),
}

kdhong[0] = "kdhong.elice"	# Error
key 확인하기
# {id: 이름}
accounts = {
    "kdhong": "Kildong Hong",
}
print("kdhong" in accounts)	# True
print("elice" in accounts)	# False
- 딕셔너리 순회하기
accounts = {
    "kdhong": "Kildong Hong",
}

for username, name in accounts.items():
    print(username + " - " + name)
JSON (JavaScript Object Notation)
- 웹 환경에서 데이터를 주고 받는 가장 표준적인 방식이다.
- 키를 이용하여 원하는 데이터만 빠르게 추출 가능하다.
- 데이터가 쉽게 오염되지 않는다.
- 다른 포맷에 비해 용량이 조금 큰 편이다.
JSON과 딕셔너리 변환
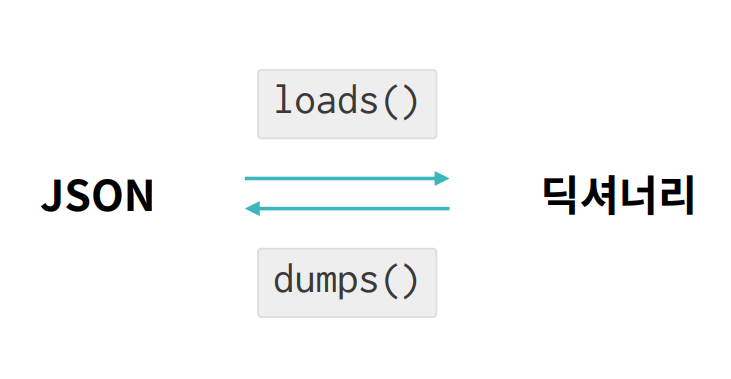
- loads() : JSON 형태의 문자열을 딕셔너리로 변환한다. 이 때, 딕셔너리의 모든 원소는 문자열 타입으로 설정된다.
- dumps() : 딕셔너리를 JSON 형태의 문자열로 변환한다.

▶ 사용자 번호: 작품 번호로 이루어진 netflix.txt을 읽고 사용자 번호를 키로, 작품 번호를 값으로 하는 딕셔너리를 생성
source_file = "netflix.txt"

def make_dictionary(filename):
    user_to_titles = {}
    with open(filename) as file:
        for line in file:
            user, title = line.strip().split(':')
            user_to_titles[user] = title

        return user_to_titles

print(make_dictionary(source_file))
▶ {사용자: [작품 리스트]} 형식으로 저장된 딕셔너리를 {사용자: 본 작품의 수}로 변환하는 함수를 작성
user_to_titles = {
    1: [271, 318, 491],
    2: [318, 19, 2980, 475],
    3: [475],
    4: [271, 318, 491, 2980, 19, 318, 475],
    5: [882, 91, 2980, 557, 35],
}
def get_user_to_num_titles(user_to_titles):
    user_to_num_titles = {}

    for user, titles in user_to_titles.items():
        user_to_num_titles[user] = len(titles)

    return user_to_num_titles

print(get_user_to_num_titles(user_to_titles))
▶ JSON 파일을 딕셔너리로 변환, 변환된 내용을 파일에 저장
# json 패키지를 import
import json

#JSON 파일을 읽고 문자열을 딕셔너리로 변환
def create_dict(filename):
    with open(filename) as file:
        json_string = file.read()

        return json.loads(json_string)


#JSON 파일을 읽고 딕셔너리를 JSON 형태의 문자열로 변환
def create_json(dictionary, filename):
    with open(filename, 'w') as file:
        json_string = json.dumps(dictionary)
        file.write(json_string)


src = 'netflix.json'
dst = 'new_netflix.json'

netflix_dict = create_dict(src)
print('원래 데이터: ' + str(netflix_dict))

netflix_dict['Dark Knight'] = 39217
create_json(netflix_dict, dst)
updated_dict = create_dict(dst)
print('수정된 데이터: ' + str(updated_dict))
2️⃣ 집합 (Set)
- 중복이 없다
- 순서가 없다
# 셋 다 같은 값
set1 = {1, 2, 3}
set2 = set([1, 2, 3])
set3 = {3, 2, 3, 1}
원소 추가 / 삭제
num_set = {1, 3, 5, 7}

num_set.add(9)
num_set.update([3, 15, 4])
num_set.remove(7)
num_set.discard(13)
remove와 discard는 모두 원소를 삭제하는 기능을 하지만,
remove(a)는 a가 집합 안에 존재해야한다. 해당 원소가 없으면 에러가 발생한다.
discard(a)는 a가 집합 안에 있으면 삭제하고 없으면 무시한다.
집합 다루기
num_set = {1, 3, 5, 7}

print(6 in num_set)	# False
print(len(num_set))	# 4
집합 연산
교집합, 합집합, 차집합, XOR
set1 = {1, 3, 5, 7}
set2 = {1, 3, 9, 27}

union = set1 | set2		# 합집합
intersection = set1 & set2	# 교집합
diff = set1 - set2		# 차집합
xor = set1 ^ set2		# XOR
▶ 작품 A와 B를 모두 시청한 사람의 수, 둘 중 하나만 시청한 사람의 수를 이용하여 두 작품의 유사도를 유추
▶ 집합 연산을 이용한 여러 작품의 시청자 통계
from viewers import dark_knight, iron_man

dark_knight_set = set(dark_knight)
iron_man_set = set(iron_man)

# 두 작품을 모두 시청한 사람의 수
both = len(dark_knight_set & iron_man_set)

# 두 작품 중 최소 하나를 시청한 사람의 수
either = len(dark_knight_set | iron_man_set)

# 다크나이트만 시청한 사람의 수
dark_knight_only = len(dark_knight_set - iron_man_set)

# 아이언맨만 시청한 사람의 수
iron_man_only = len(iron_man_set - dark_knight_set)

print("두 작품 모두 시청: {}명".format(both))
print("하나 이상 시청: {}명".format(either))
print("다크나이트만 시청: {}명".format(dark_knight_only))
print("아이언맨만 시청: {}명".format(iron_man_only))
3️⃣ 그래프 설정하기
matplotlib으로 그래프 설정
1) 한국어 표시를 위해 폰트 설정
2) 차트 제목 설정
3) X축, Y축 라벨 표시
4) 차트 여백 조정하기
import matplotlib.pyplot as plt
import matplotlib.font_manager as fm

from elice_utils import EliceUtils
elice_utils = EliceUtils()

# 날짜 별 온도 데이터 세팅
dates = ["1월 {}일".format(day) for day in range(1, 32)]
temperatures = list(range(1, 32))

# 막대 그래프의 막대 위치를 결정하는 pos 선언
pos = range(len(dates))

# 한국어를 보기 좋게 표시할 수 있도록 폰트 설정
font = fm.FontProperties(fname='./NanumBarunGothic.ttf')

# 막대의 높이가 빈도의 값이 되도록 설정
plt.bar(pos, temperatures, align='center')

# 각 막대에 해당되는 단어 입력
plt.xticks(pos, dates, rotation='vertical', fontproperties=font)

# 그래프의 제목 설정
plt.title('1월 중 기온 변화', fontproperties=font)

# Y축에 설명 추가
plt.ylabel('온도', fontproperties=font)

# 단어가 잘리지 않도록 여백 조정
plt.tight_layout()

# 그래프를 표시합니다.
plt.savefig('graph.png')
elice_utils.send_image('graph.png')


이 글은 엘리스의 AI트랙 5기 강의를 들으며 정리한 내용입니다.
'개발공부 > 🎅 Python' 카테고리의 다른 글
| [Python] Pandas 기본 알아보기 (0) | 2022.09.27 |
|---|---|
| [Python] NumPy 사용해보기 (0) | 2022.09.24 |
| [Python] TED 강연을 통해 접해 보는 복잡한 형태의 데이터 (0) | 2022.09.23 |
| [Python] 영어 단어 모음으로 시작하는 데이터 시각화 (0) | 2022.09.21 |
| [Python] 트럼프 대통령 트윗으로 시작하는 데이터 처리 (0) | 2022.09.20 |

프론트엔드 개발자 삐롱히의 개발 & 공부 기록 블로그